|
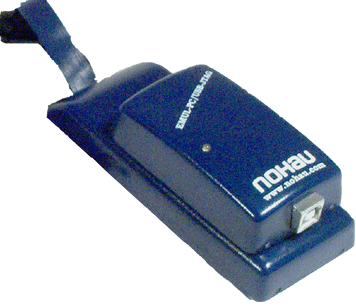
EMUL-ARM
has full support for the ARM ETM (Embedded Trace Macrocell).
We have two different interfaces for this:
- CTM
(Compact Trace Module) - traditional trace functionality
Traditionally,
JTAG debuggers have not had the capability to support trace.
This is not a design choice by the debugger designer, it is
determined by the silicon vendor. Trace support capability
has only been available with In-Circuit Emulators which rely
on the availability of "bond-out" chips, however
there are no bond-out chips for ARM at this time.
To facilitate
tracing capabilities, ARM has created the ETM which adds a
logic block inside the MCU and a number of pins (4, 8 or 16
data bits + 4 status bits) that send the information. The
more pins, the more information can be transferred. With fewer
pins, and while trying to trace too much information, there
will be an overflow internally in the MCU. Regardless of the
implementation, the ETM is always capable of tracing program
flow if all other options are disabled.
An MCU
manufacturer that wants to use the ETM needs to license it
from ARM and then put it in their MCU. This results in licensing
fees, additional silicon area and pins, which is probably
why there have not been any general-purpose MCUs with that
technology available. However, this is about to change. Philips
has released their LPC210x MCU, Atmel has announced a new
ARM9-based device with ETM, and there are more devices that
are not yet announced.
A trace
is an optional part of an emulator system that supplies advanced
debugging capabilities that include:
- Trace buffer size is 128k frames
- Storing
the execution of instructions so that the history of execution
that led up to an error situation can be analyzed
- Storing
only a small portion of the program execution (filtering),
and can be applied on address range, among others
- Setting
complex conditions that identify very specific events caused
by the microcontroller and which then can stop the trace
(triggering)
- Storing
timestamp information for every recorded "frame",
allowing you to measure how long it takes to execute certain
functions
|